Having learnt SD now let’s look at it usage. Go back to the orders example.
Average units order per day = 25 units. The actual orders are below.
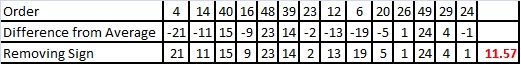
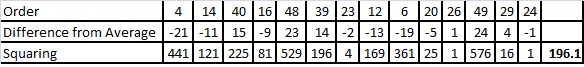
4, 14, 40, 16, 48, 39, 23, 12, 6, 20, 26, 49, 29, 24
We found SD is 14.01. Just to reiterate, SD is the average distance. To put it differently, the orders will vary by 14 units on an average which means some orders will vary below this while other will vary above this.
If you want to meet the customer demand, you would think storing 25 units is enough. The average order is 25 so why store more or less. In reality you see orders are above or below this 25. If the orders are below, you are safe but if they are above, you will miss delivery. To assure delivery, you would want to store a huge quantity that will satisfy all the orders. That’s risky too because of inventory. So you decide to store enough to cover 95% of the orders. How would you do that?. You need to find the number under will 95% of the order will fall. That’s where SD comes into play.
Before we go further, a brief introduction to Normal Distribution curve. Popularly called as “Bell Curve” this shows the probability of something falling under a certain value.
Average units order per day = 25 units. The actual orders are below.
4, 14, 40, 16, 48, 39, 23, 12, 6, 20, 26, 49, 29, 24
We found SD is 14.01. Just to reiterate, SD is the average distance. To put it differently, the orders will vary by 14 units on an average which means some orders will vary below this while other will vary above this.
If you want to meet the customer demand, you would think storing 25 units is enough. The average order is 25 so why store more or less. In reality you see orders are above or below this 25. If the orders are below, you are safe but if they are above, you will miss delivery. To assure delivery, you would want to store a huge quantity that will satisfy all the orders. That’s risky too because of inventory. So you decide to store enough to cover 95% of the orders. How would you do that?. You need to find the number under will 95% of the order will fall. That’s where SD comes into play.
Before we go further, a brief introduction to Normal Distribution curve. Popularly called as “Bell Curve” this shows the probability of something falling under a certain value.
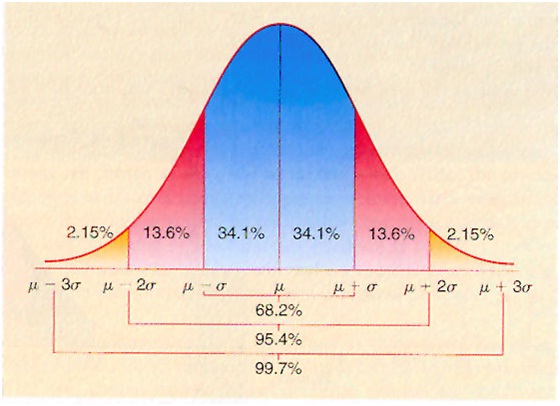
The maximum probability of something happening is 100% so the whole curve is 100%. To keep it easier we will use SD to slice the curve into equal segments. One segment equals one SD. The area of the segments represents the probability of values happening. The line in the middle is your mean which in our case is 25. Fifty percent of the values will be above the mean and 50% will be below the mean.
You can notice the father you move away from your mean the probability goes down. In other words, the probability of extreme value is less.
Now let’s go back to our question. How would you find out the value you need to stock that will take care of your orders 95% of the time. Look back at the picture. If you store 25 which is our mean you will cover days where the orders are under 25. So add up all the segments left of mean and you will get 50%. If you store Mean+SD, you will take care of 50%+34.1% = 84.1% of orders. If you store Mean+SD+SD= Mean+2SD, you will take care of 50%+34.1%+13.6%= 97.7 % of orders.
That how you find out you stock level to meet orders. If you store 25+(2*14.01)=53 units, you will have 97% of your days covered.
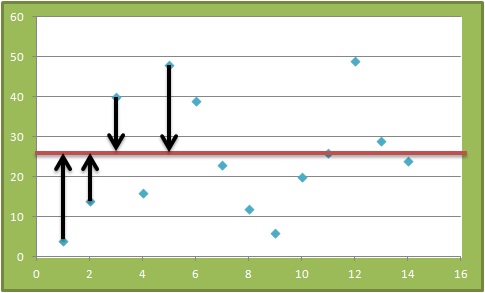
To verify, let’s go back to our data.
Orders covered at Mean+SD = 25+14 = 39 --> 84% of the days covered.
4, 14, 40, 16, 48, 39, 23, 12, 6, 20, 26, 49, 29, 24
You can see roughly 88% is covered. The numbers don’t match because our sample is limited. If you take the data for an extended period it will match.
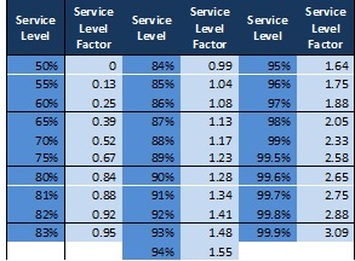
The number of segments you need to add to get your desired coverage is called the service level factor. The table below shows you the number of SD you have to add to your mean to get a certain service level. Remember, the stock level you get by this method includes your safety stock too. No need to add anything separate. Service Level Factor x SD is the safety stock.
You can notice the father you move away from your mean the probability goes down. In other words, the probability of extreme value is less.
Now let’s go back to our question. How would you find out the value you need to stock that will take care of your orders 95% of the time. Look back at the picture. If you store 25 which is our mean you will cover days where the orders are under 25. So add up all the segments left of mean and you will get 50%. If you store Mean+SD, you will take care of 50%+34.1% = 84.1% of orders. If you store Mean+SD+SD= Mean+2SD, you will take care of 50%+34.1%+13.6%= 97.7 % of orders.
That how you find out you stock level to meet orders. If you store 25+(2*14.01)=53 units, you will have 97% of your days covered.
To verify, let’s go back to our data.
Orders covered at Mean+SD = 25+14 = 39 --> 84% of the days covered.
4, 14, 40, 16, 48, 39, 23, 12, 6, 20, 26, 49, 29, 24
You can see roughly 88% is covered. The numbers don’t match because our sample is limited. If you take the data for an extended period it will match.
The number of segments you need to add to get your desired coverage is called the service level factor. The table below shows you the number of SD you have to add to your mean to get a certain service level. Remember, the stock level you get by this method includes your safety stock too. No need to add anything separate. Service Level Factor x SD is the safety stock.
Next we will get into 6 sigma and other voodo stuff


 RSS Feed
